MLB 2020 Postseason Projections
Just over 6 months after the 2020 MLB season was postponed indefinitely and just under 3 months after the 60-game schedule was announced the 2020 postseason begins today. While MLB postseason results are often compared to a crapshoot, it doesn’t stop us from trying to predict the outcome.
In 2018 I posted projections for the Dodgers-Red Sox series based on an even earlier post on probabilistic ranking.
This year, I’ve taken the 2018 model (with a few small tweaks) and used it to simulate the entire 2020 postseason. The table below shows the results, with the Dodgers and Rays, unsurprisingly, topping the list as World Series favorites. Note that teams that did not make the postseason are also included, with a 0% chance of any success.
| Probability of Becomming | |||||
|---|---|---|---|---|---|
| Wild Card Champion | Division Champion | League Champion | World Series Champion | ||
| Team | Division | ||||
| LAD | NL West | 74.68 | 50.98 | 38.32 | 26.24 |
| TB | AL East | 64.00 | 39.22 | 24.91 | 13.93 |
| SD | NL West | 61.98 | 27.38 | 17.13 | 9.39 |
| MIN | AL Central | 64.59 | 33.90 | 16.55 | 7.76 |
| CWS | AL Central | 51.91 | 28.39 | 13.89 | 6.36 |
| CLE | AL Central | 53.11 | 24.98 | 12.74 | 5.69 |
| ATL | NL East | 56.37 | 30.68 | 11.70 | 5.40 |
| OAK | AL West | 48.09 | 25.54 | 11.82 | 4.84 |
| CHC | NL Central | 53.79 | 27.78 | 10.28 | 4.48 |
| NYY | AL East | 46.89 | 19.50 | 9.11 | 3.71 |
| MIA | NL East | 46.21 | 20.99 | 6.92 | 2.63 |
| TOR | AL East | 36.00 | 16.30 | 7.22 | 2.58 |
| CIN | NL Central | 43.63 | 20.55 | 6.67 | 2.50 |
| STL | NL Central | 38.02 | 12.26 | 5.44 | 2.06 |
| HOU | AL West | 35.41 | 12.17 | 3.76 | 1.23 |
| MIL | NL Central | 25.32 | 9.38 | 3.54 | 1.20 |
| SEA | AL West | 0.00 | 0.00 | 0.00 | 0.00 |
| SF | NL West | 0.00 | 0.00 | 0.00 | 0.00 |
| PIT | NL Central | 0.00 | 0.00 | 0.00 | 0.00 |
| TEX | AL West | 0.00 | 0.00 | 0.00 | 0.00 |
| ARI | NL West | 0.00 | 0.00 | 0.00 | 0.00 |
| PHI | NL East | 0.00 | 0.00 | 0.00 | 0.00 |
| NYM | NL East | 0.00 | 0.00 | 0.00 | 0.00 |
| LAA | AL West | 0.00 | 0.00 | 0.00 | 0.00 |
| KC | AL Central | 0.00 | 0.00 | 0.00 | 0.00 |
| DET | AL Central | 0.00 | 0.00 | 0.00 | 0.00 |
| COL | NL West | 0.00 | 0.00 | 0.00 | 0.00 |
| BOS | AL East | 0.00 | 0.00 | 0.00 | 0.00 |
| BAL | AL East | 0.00 | 0.00 | 0.00 | 0.00 |
| WSH | NL East | 0.00 | 0.00 | 0.00 | 0.00 |
Appendix
Other projections
For further context, you can compare my projections with mlb.com’s projections as well as fivethirtyeight’s. To convert mlb.com’s expert predictions to probabilities I counted each time an analyst projected a team to win a title and divided by the number of analysts (12).
| DG: Probability of Becomming | MLB: Probability of Becomming | fivethirtyeight: Probability of Becomming | |||||||||||
|---|---|---|---|---|---|---|---|---|---|---|---|---|---|
| Wild Card Champion | Division Champion | League Champion | World Series Champion | Wild Card Champion | Division Champion | League Champion | World Series Champion | Wild Card Champion | Division Champion | League Champion | World Series Champion | ||
| Team | Division | ||||||||||||
| LAD | NL West | 73.86 | 49.43 | 36.67 | 24.65 | 100.0 | 92.0 | 92.0 | 75.0 | 77.0 | 58.0 | 45.0 | 32.0 |
| TB | AL East | 63.30 | 38.90 | 24.44 | 13.66 | 92.0 | 50.0 | 58.0 | 17.0 | 69.0 | 38.0 | 21.0 | 10.0 |
| SD | NL West | 61.89 | 28.45 | 17.63 | 9.56 | 83.0 | 8.0 | 8.0 | 0.0 | 59.0 | 20.0 | 11.0 | 5.0 |
| MIN | AL Central | 63.83 | 33.40 | 16.99 | 7.92 | 100.0 | 75.0 | 0.0 | 0.0 | 55.0 | 32.0 | 17.0 | 8.0 |
| CWS | AL Central | 51.68 | 27.90 | 13.17 | 6.00 | 58.0 | 8.0 | 0.0 | 0.0 | 43.0 | 17.0 | 7.0 | 2.0 |
| ATL | NL East | 56.78 | 31.64 | 12.20 | 5.97 | 25.0 | 17.0 | 0.0 | 0.0 | 58.0 | 35.0 | 13.0 | 7.0 |
| CLE | AL Central | 53.07 | 24.62 | 12.32 | 5.42 | 25.0 | 8.0 | 8.0 | 8.0 | 46.0 | 21.0 | 10.0 | 4.0 |
| OAK | AL West | 48.32 | 25.17 | 11.63 | 5.02 | 42.0 | 17.0 | 0.0 | 0.0 | 57.0 | 26.0 | 12.0 | 5.0 |
| CHC | NL Central | 54.58 | 27.82 | 10.47 | 4.86 | 42.0 | 8.0 | 0.0 | 0.0 | 68.0 | 32.0 | 11.0 | 5.0 |
| NYY | AL East | 46.93 | 19.44 | 9.19 | 3.82 | 75.0 | 33.0 | 33.0 | 0.0 | 54.0 | 30.0 | 17.0 | 8.0 |
| TOR | AL East | 36.70 | 17.04 | 7.78 | 3.17 | 8.0 | 0.0 | 0.0 | 0.0 | 31.0 | 11.0 | 4.0 | 1.0 |
| CIN | NL Central | 43.22 | 20.36 | 6.82 | 2.56 | 83.0 | 83.0 | 0.0 | 0.0 | 42.0 | 23.0 | 7.0 | 3.0 |
| MIA | NL East | 45.42 | 20.18 | 6.53 | 2.47 | 50.0 | 0.0 | 0.0 | 0.0 | 32.0 | 10.0 | 2.0 | 0.0 |
| STL | NL Central | 38.11 | 12.33 | 5.84 | 2.34 | 17.0 | 0.0 | 0.0 | 0.0 | 41.0 | 12.0 | 6.0 | 2.0 |
| HOU | AL West | 36.17 | 13.53 | 4.48 | 1.41 | 0.0 | 0.0 | 0.0 | 0.0 | 45.0 | 25.0 | 12.0 | 5.0 |
| MIL | NL Central | 26.14 | 9.79 | 3.84 | 1.17 | 0.0 | 0.0 | 0.0 | 0.0 | 23.0 | 11.0 | 5.0 | 2.0 |
| SEA | AL West | 0.00 | 0.00 | 0.00 | 0.00 | 0.0 | 0.0 | 0.0 | 0.0 | 0.0 | 0.0 | 0.0 | 0.0 |
| SF | NL West | 0.00 | 0.00 | 0.00 | 0.00 | 0.0 | 0.0 | 0.0 | 0.0 | 0.0 | 0.0 | 0.0 | 0.0 |
| PIT | NL Central | 0.00 | 0.00 | 0.00 | 0.00 | 0.0 | 0.0 | 0.0 | 0.0 | 0.0 | 0.0 | 0.0 | 0.0 |
| TEX | AL West | 0.00 | 0.00 | 0.00 | 0.00 | 0.0 | 0.0 | 0.0 | 0.0 | 0.0 | 0.0 | 0.0 | 0.0 |
| ARI | NL West | 0.00 | 0.00 | 0.00 | 0.00 | 0.0 | 0.0 | 0.0 | 0.0 | 0.0 | 0.0 | 0.0 | 0.0 |
| PHI | NL East | 0.00 | 0.00 | 0.00 | 0.00 | 0.0 | 0.0 | 0.0 | 0.0 | 0.0 | 0.0 | 0.0 | 0.0 |
| NYM | NL East | 0.00 | 0.00 | 0.00 | 0.00 | 0.0 | 0.0 | 0.0 | 0.0 | 0.0 | 0.0 | 0.0 | 0.0 |
| LAA | AL West | 0.00 | 0.00 | 0.00 | 0.00 | 0.0 | 0.0 | 0.0 | 0.0 | 0.0 | 0.0 | 0.0 | 0.0 |
| KC | AL Central | 0.00 | 0.00 | 0.00 | 0.00 | 0.0 | 0.0 | 0.0 | 0.0 | 0.0 | 0.0 | 0.0 | 0.0 |
| DET | AL Central | 0.00 | 0.00 | 0.00 | 0.00 | 0.0 | 0.0 | 0.0 | 0.0 | 0.0 | 0.0 | 0.0 | 0.0 |
| COL | NL West | 0.00 | 0.00 | 0.00 | 0.00 | 0.0 | 0.0 | 0.0 | 0.0 | 0.0 | 0.0 | 0.0 | 0.0 |
| BOS | AL East | 0.00 | 0.00 | 0.00 | 0.00 | 0.0 | 0.0 | 0.0 | 0.0 | 0.0 | 0.0 | 0.0 | 0.0 |
| BAL | AL East | 0.00 | 0.00 | 0.00 | 0.00 | 0.0 | 0.0 | 0.0 | 0.0 | 0.0 | 0.0 | 0.0 | 0.0 |
| WSH | NL East | 0.00 | 0.00 | 0.00 | 0.00 | 0.0 | 0.0 | 0.0 | 0.0 | 0.0 | 0.0 | 0.0 | 0.0 |
The model
The model is relatively straightforward. For each team, we learn a latent factor, $a_{t}$, representing their ability to win based on the outcomes of every series in the 2020 regular season. Technically this is a probabilistic model, so the latent factors are really distributions. The distributions are fit such that
\[\begin{equation} \frac{\text{exp}(a_{t1})}{\text{exp}(a_{t_{1}}) + \text{exp}(a_{t_{2}})} \end{equation}\]represents the probability that team $t_{1}$ will beat $t_{2}$ in a given game. The code looks like
with pm.Model() as model:
    σ_a = pm.Exponential('σ_a', np.log(5))

    a_t = pm.Normal('a_t', mu=0, sigma=σ_a, shape=n_teams)
    a_1, a_2 = a_t[home_team_id], a_t[away_team_id]
    a = T.stack([a_1, a_2]).T

    p = pm.Deterministic('p', softmax(a))
    wins = pm.Binomial('wins', n=n_matchups, p=p, shape=(n_games, 2), observed=observed_wins)

    trace = pm.sample(5_000, tune=4_000)
Once the model is fit we can sample from each team’s distributions (more precisely, we sample from the samples approximating the posterior) and simulate a postseason outcome. After doing this a bunch we end up with probabilities for each team’s postseason success.
For full details you can find the notebook used to generate the projections on my GitHub below or read up on the earlier blog posts I linked above.
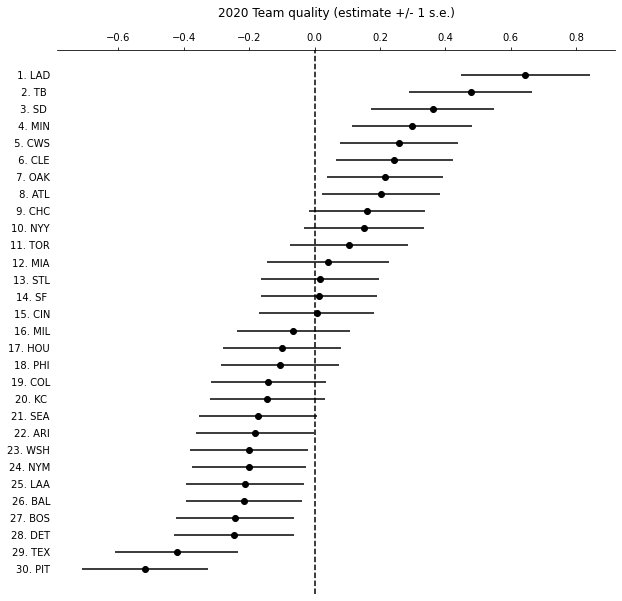
One notable difference between this model and the 2018 model is that home team advantage is not accounted for. While playing games on the road versus at home certainly had an impact this season, all postseason games are being played on neutral sites so we left this feature out. Another change is that the softmax function is used to calculate the probability of winning as opposed to the Dirichlet distribution. The methods are the same, except the softmax uses an exponential transform which allows the distributions to include negative values and results in more consistent distributions, regardless of team ability (compare the team quality estimates below to my earlier post).
As before the teams can be ranked according to the learned distributions.