
Evaluating my 2020 MLB Predictions - Part 1, Pete Alonso
At the beginning of March I published predictions on how many home runs Pete Alonso would hit this season. Now that the season is over, let’s see how they stack up.
Background
For anyone interested, the full background on the model and corresponding MLB context, is linked above. For everyone else, here is all you need to know for the purposes of this discussion.
The New York Mets’ Pete Alonso played his first MLB campaign in 2019, and it was historic. He hit the ground running and never looked back, hitting a total of 53 home runs which set the league record for most home runs hit by a rookie and helped earn him the Rookie of the Year award.
At the same time, 2019 was a remarkable season itself, due to the significant increase in home runs hit across the entire league - an effect due to a physical change in the way that the baseballs were being manufactured which resulted in less drag.
Both of these facts made predicting how many home runs Alonso would hit in 2020 especially challenging. We knew that Alonso was good, probably much better than the average player, but repeating 53 home runs was very unlikely. In other words, his only season of data was probably an outlier. On top of that, we also knew that part of his 2019 success was biased by external circumstances we couldn’t directly measure.
We tried to approach this challenge by building a model that controlled for the juiced-ball effect and used data from other MLB players to help learn to generalize Alonso’s 2019 season. Additionally, the model was probabilistic by design allowing us to generate upper and lower bounds per number of plate appearances. In hindsight, conditioning on number plate appearances was fortuitous because it allowed us to evaluate the predictions even after the MLB season had been sidelined for three and a half months before ultimately being truncated to a 60 game season (opposed to the normal 162 game schedule).
Evaluation
Now that we’ve covered the necessary background, let’s take a look at how the model performed.
For this modeling approach there are two items we should check. The first is whether the prediction intervals contain most of the actual data points. (Remember, it’s a 90% credible interval, so it’s okay, even expected, that some points might fall outside.) The second check is whether the intervals actually make sense given the number of home runs Alonso hit. Note that the first criteria could easily be satisfied by producing very large confidence intervals. However such a model wouldn’t have any practical utility nor be very interesting. Imagine a model that just predicts “between 0 and 53 home runs”. Would it be correct? Yes. Informative? No. Thus both checks are important.
Let’s take a look at Alonso’s actual 2020 numbers alongside the model’s predicted ranges.
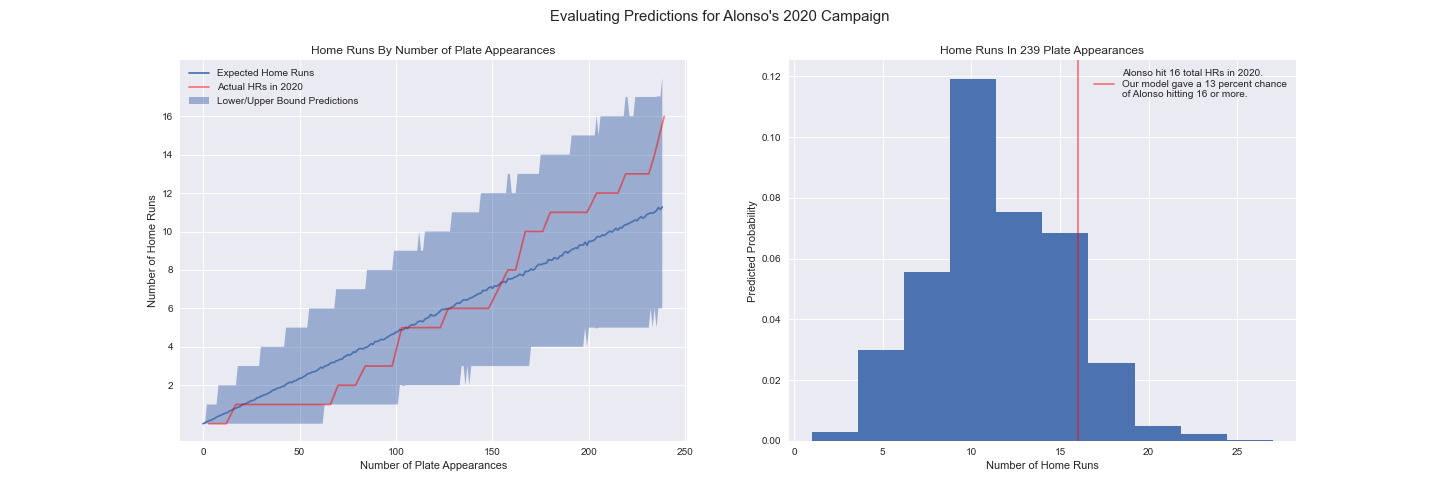
We can see that the actual number of home runs he hit is contained within the confidence interval for the entirety of the season. This is a good sign and shows our model passes the first test.
How does the width of the intervals compare to the outcomes? This also appears to check out. The intervals seem to be “just wide enough”. They even account for Alsono’s early season slump. This is a really good sign that we didn’t overfit to Alonso’s 2019 campaign - remember we only have one season of data for Alonso in which he took off like a rocket and never slowed down. If we overfit to 2019 we may not have captured that slump.
Lastly, looking at the histogram plotted above, we see that despite Alonso’s early-season struggles and letting stats such as batting average, on base percentage and slugging drop compared to last year he still hit a decent number of total home runs according to our model. Given his total appearances, our model had an 88% chance of him hitting less than the 16 home runs he managed to pull off in the end. Even though he’s a division rival, my hat’s off to Alonso for pulling out of his slump and getting back on track.
Partial Pooling for the Win
On a technical note, this is a pretty good case study for the merits of partial pooling, as opposed to models that completely pool the data or don’t use pooling at all.
Un-technically, complete pooling assumes no one player’s potential for hitting home runs is different from any other’s. This method would use all available data to generate a single prediction for the entire league.
On the other hand, we have no pooling models that would assume each player’s ability to hit one out of the park is unique to that player alone and is not to be informed by other players throughout the league.
Partial pooling, which was used in the model shown above, is a technique that tries to blend the two approaches, using both the player’s historical performances as well as data from others to make a prediction. The assumption here is that even though each player has their own individual talent, players share similarities with one another. A priori this seemed like a good approach to help compensate for our lack of data. With partial pooling, the model can learn about how other players like Alonso perform from year to year with their own ups and downs and use this information to make a prediction about how Alonso’s future performance might vary from his 2019 season. In this sense, partial pooling helps regularize the model.
To further illustrate the differences in these methods I’ve replicated the plot above using predictions from no pooling and complete pooling models . Other than how pooling is used, the no pooling, complete pooling and partial pooling models are identical.

Unsurprisingly, the first model overfits to 2019. Although the season totals do line up at the end of the season, we see the actuals trailing below our point estimate for the duration. Also, the upper bound on the season total is 24 home runs. This seems rather high for a 90% credible interval in a season where 25 home runs would have seemed incredible. All of this suggests the no-pooling model is expecting a repeat of Alonso’s phenomenal 2019 season.
On the other hand, the complete pooling model underfits, failing to capture how many home runs Pete actually hit during the final stretch of the season.
To be fair, making comparisons against complete pooling model is really a straw man argument because fundamentally this model is trying to describe league-wide home run rates, when we’ve already supposed that Alonso should be closer to the top of that distribution.
The no-pooling model is a more legitimate comparison because it makes player-by-player predictions and is the default assumption in most linear models. For example, sklearn’s linear regressors (or their classifiers for that matter) are no-pooling models. This isn’t to say there is anything wrong with those models, rather the point is to illustrate that in certain situations they can be prone to overfitting when a partial pooling model would be more robust.
Conclusion
Of course, their is a fair amount of subjectivity in this analysis, which is why I used phrases such as “this is a good sign the model didn’t overfit” and not “this proves the model didn’t overfit”.
Nevertheless this is a good exercise in model evaluation using visualizations and domain knowledge, both of which are important tools when building models for applications which are lacking data, as is the case studied here.