
Evaluating my 2020 MLB Predictions - Part 2, The Postseason
This was my third year in a row making some sort of world series predictions (you can find previous year’s predictions here). This time around, however, I took it one step further and predicted the outcomes of the entire MLB postseason. Now that the season is over let’s see how they did.
Background
I’ll briefly cover the minimum background necessary for those unfamiliar with major league baseball, or my earlier post which described my postseason model.
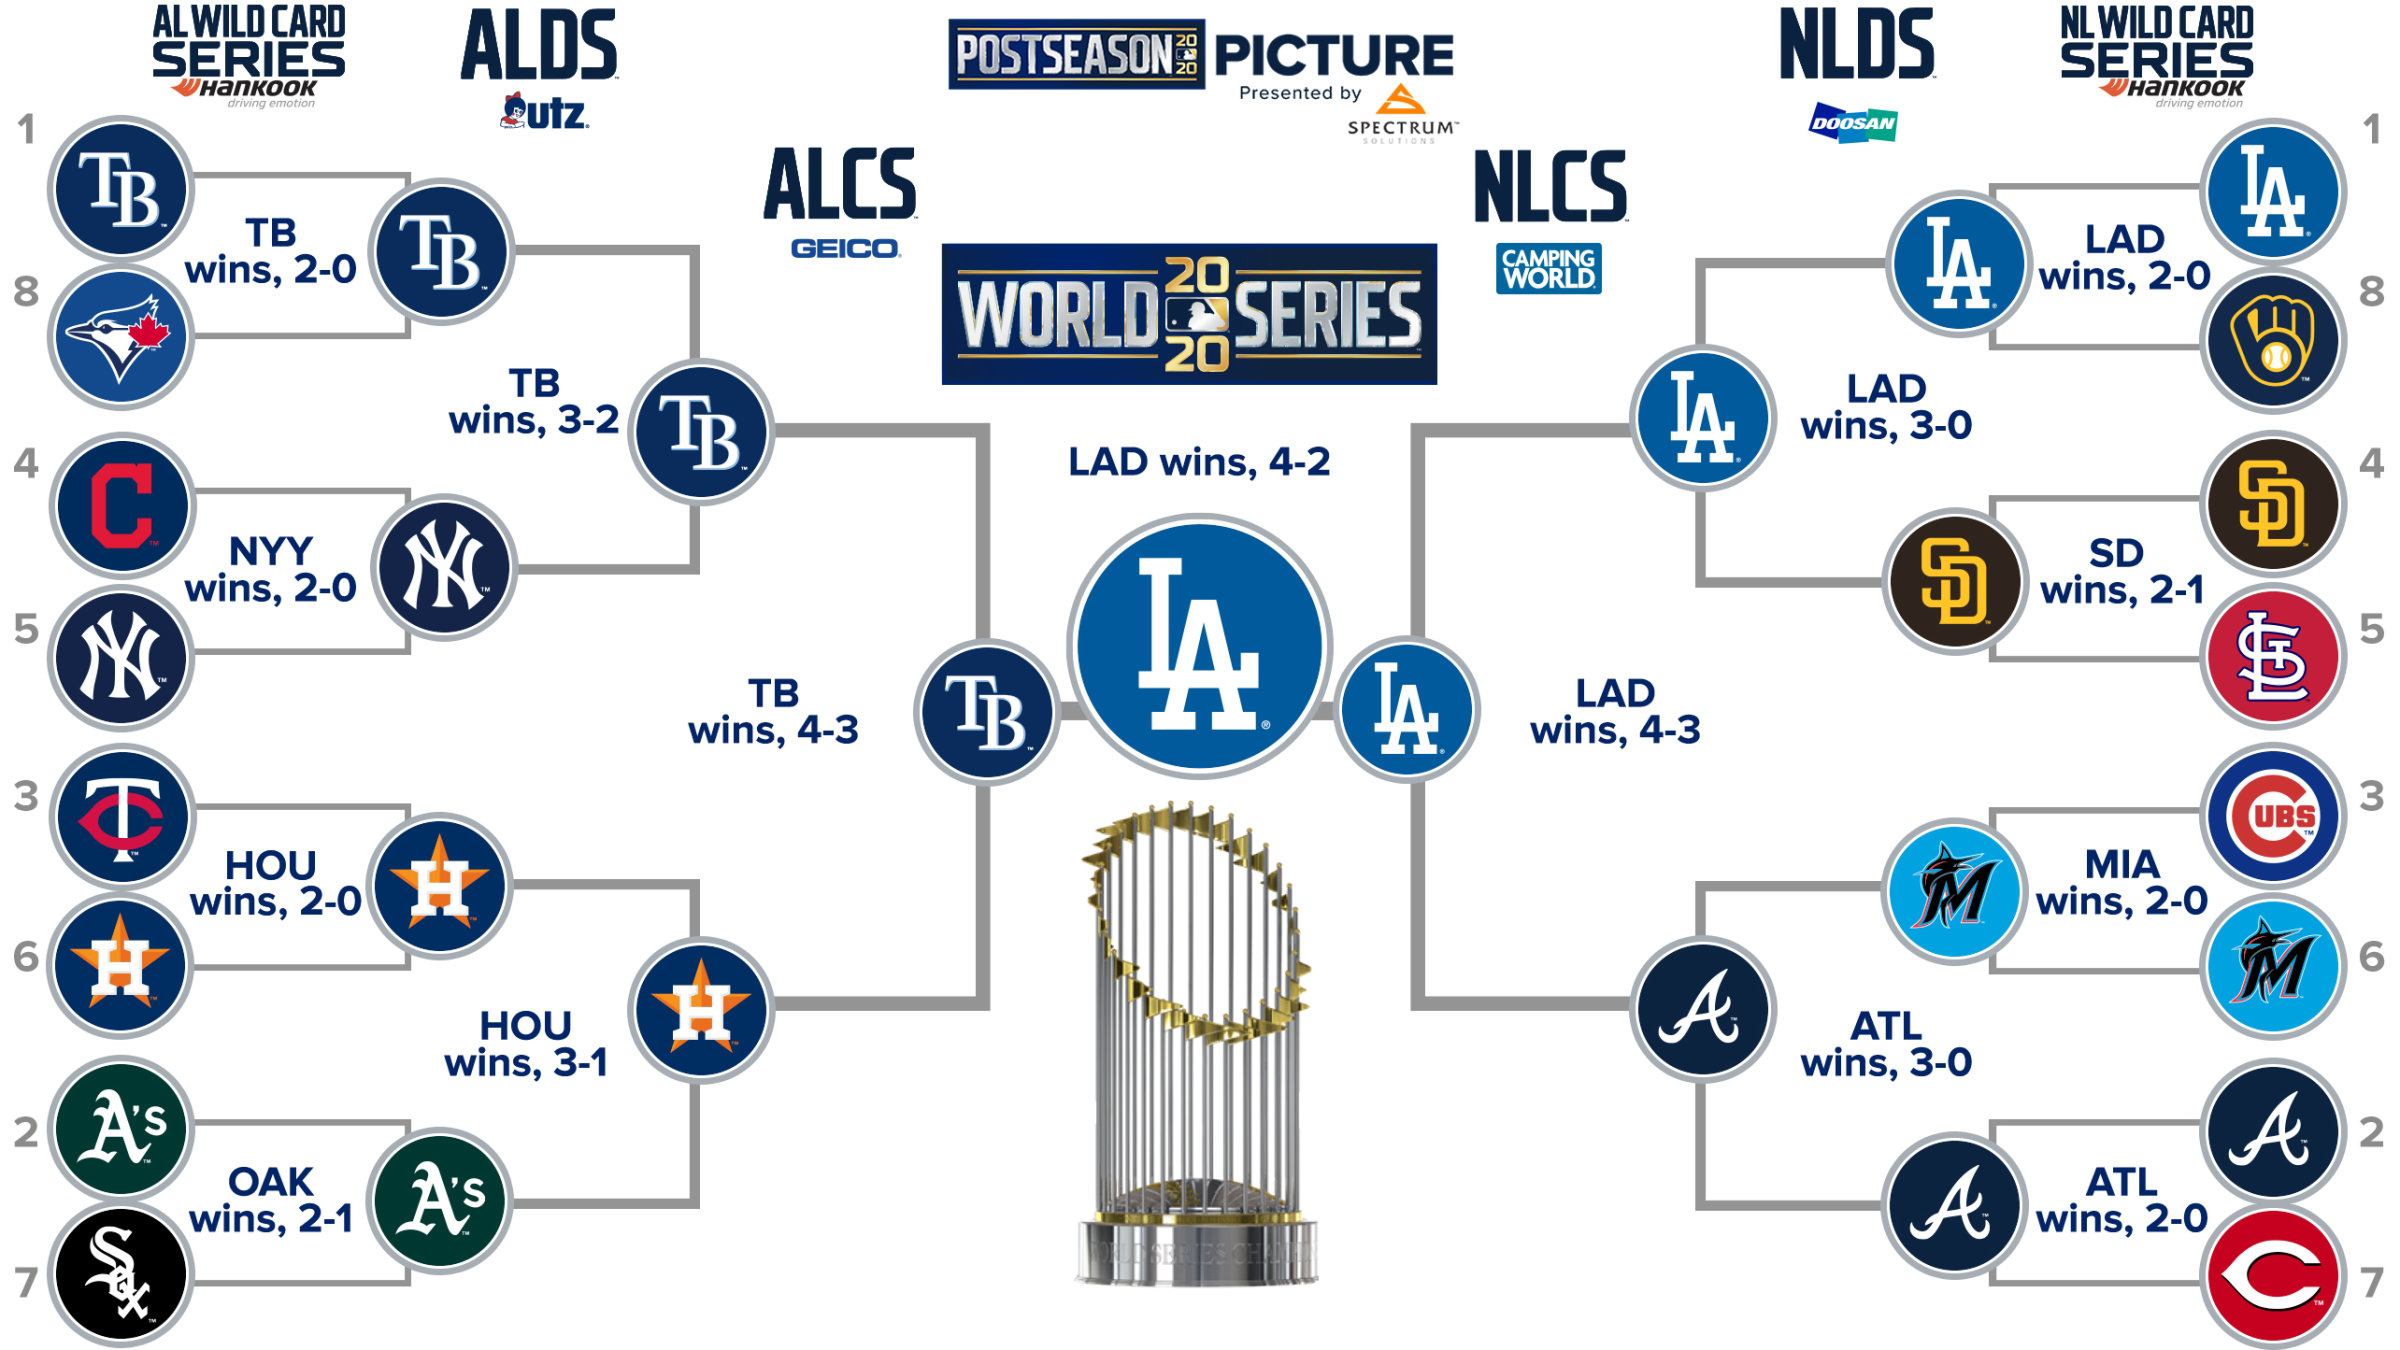
This year, 16 teams made major league baseball’s postseason. The playoff format consisted of a bracket with four rounds (the Wild Card Series, Division Series, Championship Series and the World Series). The completed bracket looks like this.
Rather than predicting the postseason outcome directly (the equivalent of filling out a march madness bracket) I generated probabilities that team $X$ would make it at least as far as round $Y$. In my original post I published these predictions alongside forecasts from fivethirtyeight and mlb.com.
Evaluations
Since our evaluations are probabilistic, we can look at the likelihood each forecast assigned to the actual outcomes, for example: “What was the model’s likelihood of the Dodgers winning the World Series?” or “What was the model’s likelihood that the Yankees would win the Wild Card, but advance no further?” In theory the better the model, the higher the likelihood assigned to the actual outcomes (more on this later).
If we run this calculation each team that advanced beyond the Wild Card Series and then average the results we have
| Forecast | Average Likelihood |
|---|---|
| DG | 0.21445 |
| FiveThirtyEight | 0.24 |
| mlb.com | 0.40625 |
| Random Chance | 0.335938 |
Notice the “Random Chance” model, included as a reference point, which assumes the outcome of every game is random, e.g. each team has a $1/16$ chance of winning the World Series, $1/8$ of winning the Championship Series, etc.
Interestingly, only mlb.com outperforms the Random Chance model on average. This is further illustrated by examining each prediction individually. (Note that we aren’t including teams that lost in the first round since they are implicitly accounted for in the other predictions.)
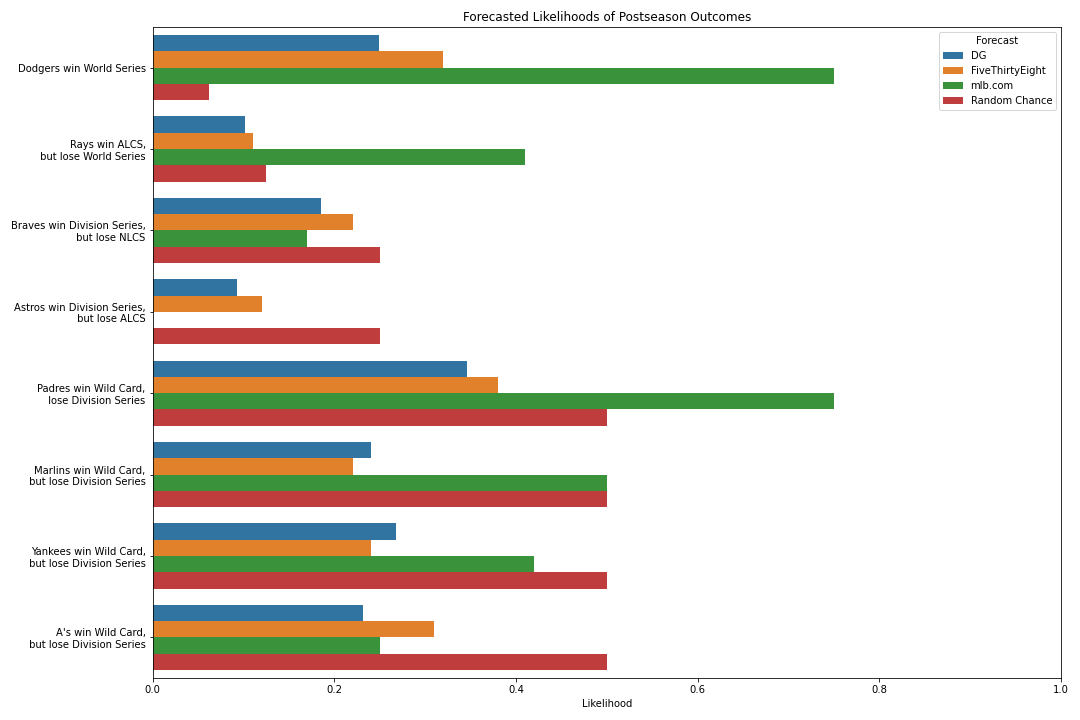
This effect stands out even more if we compare how much more likely each outcome is according to the forecast than what random chance alone would suggest.

Taking a step back
So what do we make of these evaluations? This is a machine learning blog, shouldn’t the story line be “data science for the win, experts’ predictions fail spectacularly?” Maybe not.
Let’s take a step back and consider the assumptions behind each model.
Both FiveThirtyEight and myself produced probabilistic models based on many simulations to determine the likelihoods of the many ways the postseason could work out (I ran 10,000 simulations, FiveThirtyEight ran 100,000). Remember there are over 32,000 ways the season could theoretically work out. Our models were focused on exploring the likelihood of each possibility.
On the other hand, mlb.com’s 12 analysts each took their best guess as to what they thought the most likely outcome to be. I averaged all 12 brackets to get probabilities for the convenience of including them alongside my own, but, fundamentally, their analysts were trying to answer a different question than FiveThirtyEight or myself which is a bit misrepresented in aggregate.
This helps explain why the aggregate mlb.com predictions place so much more probability on the Dodgers winning the World Series over the Rays than does FiveThirtyEight’s or my own. If you made predictions based on regular season performance alone, this is exactly what you would expect the most likely scenario to be - after all both teams had claimed the best records in their respective league during the regular season.
Total likelihood
Perhaps another metric to consider is the likelihood of the postseason outcome as a whole - the fundamental question our simulations addressed. That is, for each forecast calculate
\[\begin{align*} & \ \text{Pr(Dodgers won the World Series)} \\ \times & \ \text{Pr(Rays won the ALCS, lost the World Series)} \\ \times & \ \text{Pr(Braves won the NLDS, lost the NLCS)} \\ \times & \ \ldots \end{align*}\]Under this metric, we find FiveThirtyEight assigning the greatest likelihood to the actual outcome.
| Forecast | Total Likelihood |
|---|---|
| DG | 2.26652e-06 |
| FiveThirtyEight | 5.77997e-06 |
| mlb.com | 0 |
| Random Chance | 3.05176e-05 |
Additionally, mlb.com gave a 0 percent chance to the actual postseason outcome. Does this mean data science can declare victory over the analysts? Well, not really. Again mlb.com was answering a different question. To avoid this scenario, at least one analyst would have had to predict the postseason bracket perfectly, which is extremely unlikely (the chances are 12 / 32,768).
Either way, we are still left with explaining why the simulation based forecasts assign less likelihood than what random chance would allow.
The answer may simply be that the actual outcome was in fact less likely than random chance. For example, all three forecasts gave the Twins a better than 50-50 chance of beating the Astros in the wild card series, yet they lost. Supposing that the forecasts were correct, the actual outcome then, for that particular series, was indeed less likely than random chance.
While this answer may be on point, it isn’t always a satisfying one. In fact, it reminds me of a recent SNL skit skit that coincidentally pokes fun at Nate Silver. In the skit, Nate claims that there is only a 1/6 chance of Trump winning the election - or the same as rolling a 1 on a six sided die, he says. To demonstrate, he rolls a die and gets… a 1. Rolls again and gets… a 1. To which he says “this just shows that it’s technically possible, however, unlikely”.
Of course we all know that, unless the die is fixed, if Nate keeps rolling the die, the percentage of 1’s will swing back towards 1/6. In our case, there is evidence that we might see something similar with simulation based models if they were evaluated on multiple postseason outcomes. For example, we’ve had 2 Wild Card teams win the World Series since the postseason rosters were expanded in 2012, suggesting that unlikely outcomes may happen more often than not. This is also in line with the general consensus that anything can happen in baseball. Keeping that in mind, FiveThirtyEight gave the last year’s World Series Champions, the Nationals, a 5% chance of winning the World Series before the postseason started, whereas only one mlb.com analyst predicted they would even make it as far as the World Series, suggesting the statistical methods might be better suited to accurately represent these outcomes.
Conclusion
Unfortunately, the results in this post are inconclusive. There are a couple of practical takeaways from this exercise, however.
First, this demonstrates that evaluating statistical models which only realize a single outcome can be difficult. There is a benefit of having a distribution of errors as opposed to a single error point that greatly simplifies evaluations.
On a similar note, this post illustrates the importance of planning how a model will be evaluated ahead of time. This is just a blog post, so the stakes don’t really matter here. In practice however, just the opposite is true. I can say from experience that you definitely don’t want to end up in a situation where you’ve released a model to production only to realize later that you can’t actually capture its performance.
Lastly, as the SNL skit makes clear, we need to think carefully about communicating these results to non-practitioners. Even as someone who has been doing this for a while, I kept finding myself writing things in this post such as “model $X$ is $Y$ times more likely than random chance” - only to realize my mistake and rewrite “the forecasted likelihood of model $X$ is $Y$ times the likelihood due to random chance”. Though pedantic, the corrected statement highlights that the results I was actually able to achieve were substantially less conclusive than I was hoping for. At the same time, this illustrates that, even with experience, technical jargon and details, though they have their place, can become distracting and even confusing. Failing to clearly communicate our results and how they should be interpreted can lead to failed expectations, which is an easy way to build up a lack of trust in a model.